


System Architecture

FEMS Dashboards
Feature Highlights
Benefits


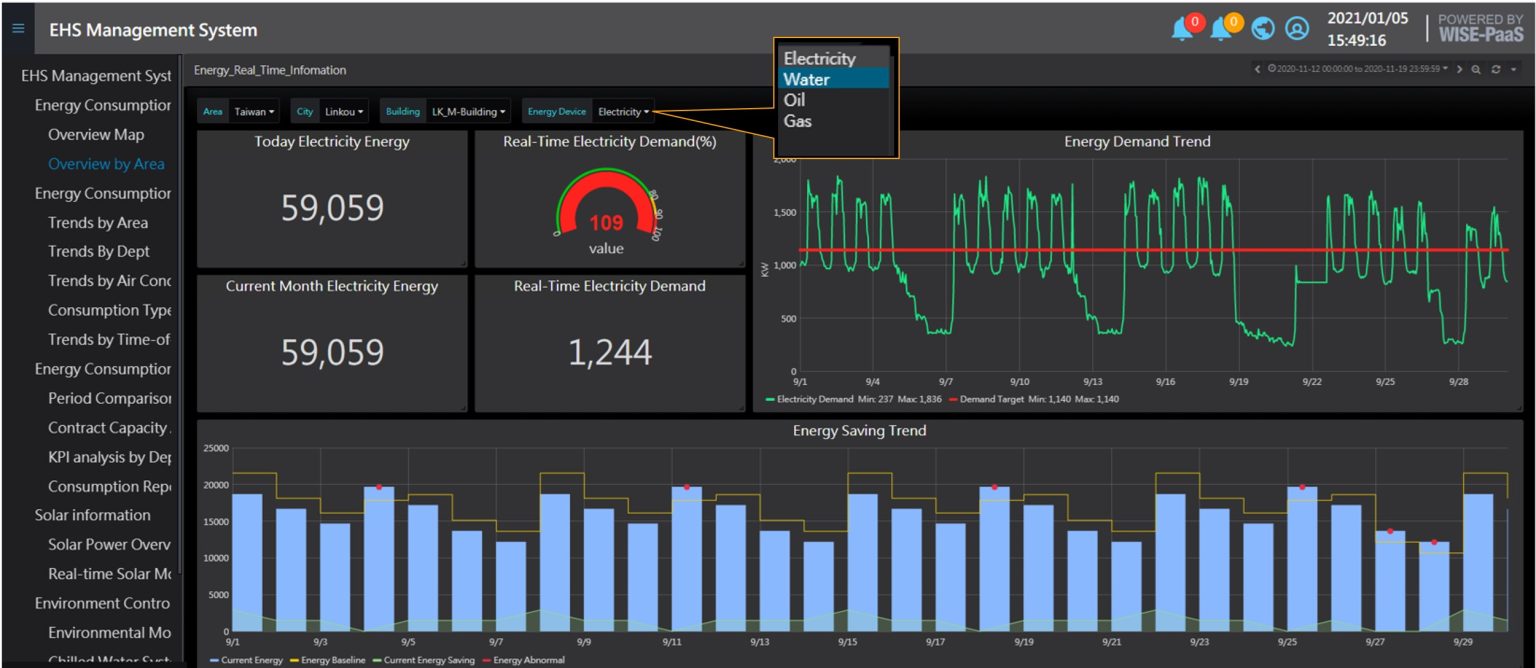
Energy Consumption Overview
Dashboards present energy consumption of the plant for users to monitor consumption as well as the cumulative value of usage for any month. It also compares energy consumption over the same period for the past three years to monitor short-term changes or identify long-term trends
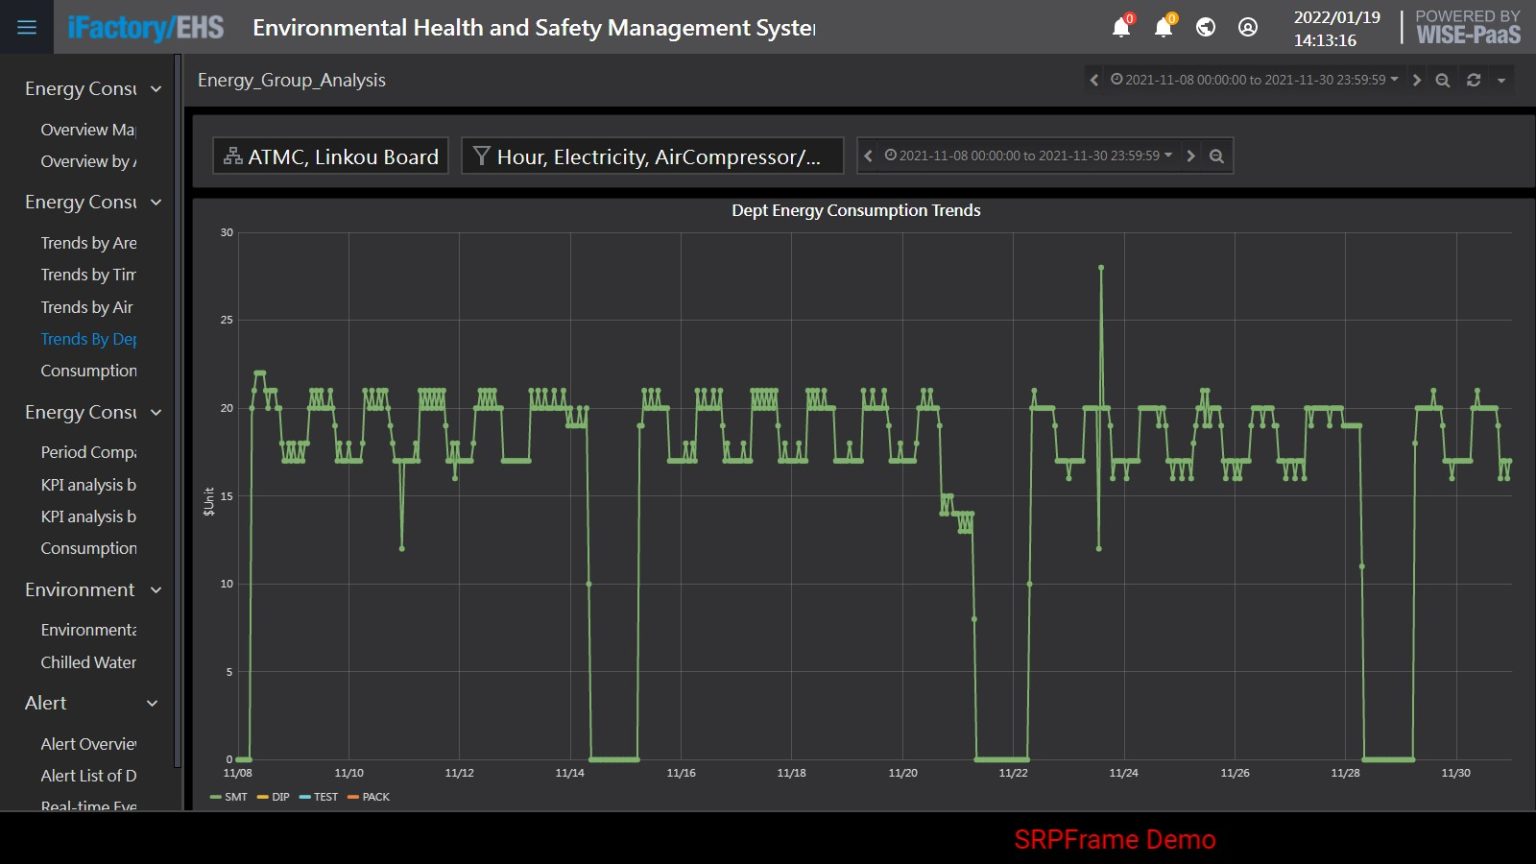
Sectoral Energy Consumption Trends
Energy consumption types: water, gas, oil and electricity. Then select the energy consumption sub-items to be counted. The upper right corner can select a time interval to facilitate the comparison of energy consumption trends between departments.
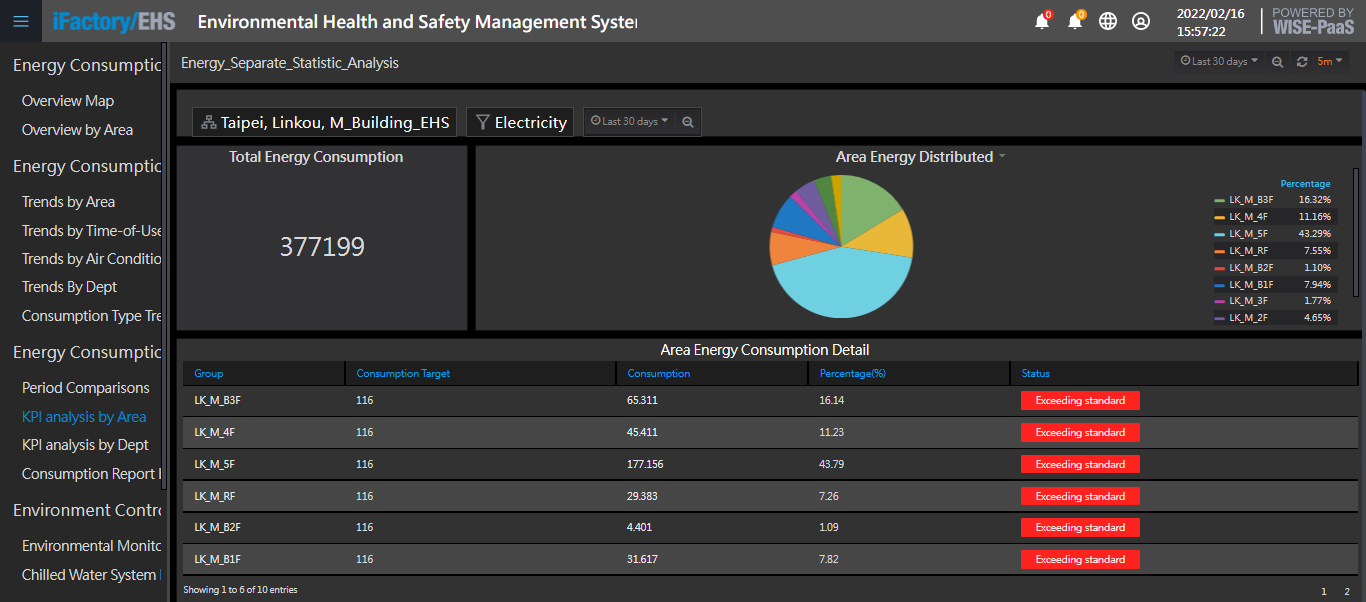
Departmental Evaluation Analysis
This is a useful dashboard to review each department and unit for avoiding waste and improving energy efficiency for better energy management.


Improve Efficiency
Visualize factory energy data Prevent low performance operation of equipment Improve energy cost per unit Enhance KPI tracking and management

Reduce Waste
Enable transparency on energy usage Ascertain the cause of unusual energy consumption Eliminate routine waste Improve stand-by operation

Increase Profit
Reduce energy cost Cut down unnecessary waste Improve productivity and management Enhance awareness of energy efficiency improvement
